
A journey in Process Simulation: from bullet-proofing Automation to a reliable Digital Twin
Written by Alessandro Turco
3 July 2024 · 7 min read

I’ve been teaching BPMN to our new employees for the last five years, at least. I just had a small talk at our recent ESTECO Users’ Meeting where I said that BPMN is easy; at least its grammar and semantics are easy. Then, you have to practice a lot to be fluent, precise and concise. Nevertheless, a supposed bug appeared in our internal tracking system that made me rethink my beliefs and teaching abilities. Fortunately, process simulation can solve this doubt and many others.
Be careful when mixing gateways
Let’s imagine a simple process: a preliminary task, then a couple of things that can be done in parallel, and a final check. If everything goes well, the process ends; otherwise you need to do the two parallel tasks again. The first (wrong!) draft could be the following one:
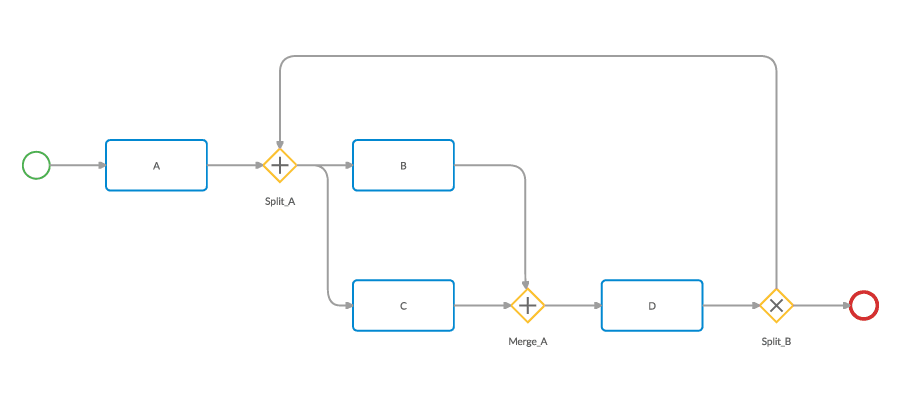
A colleague of mine, a trained (by me) and experienced one, tried to automate this process with our software for engineering applications VOLTA. He reported a bug: if the final check fails and the Exclusive Gateway triggers the “no” arrow, the process gets stuck. I’m pretty sure that I always said, “Be careful when mixing exclusive and parallel gateways” in my lectures, but here’s the most typical deadlock anyway. When merging flows, a Parallel Gateway works as a synchronization point: it waits for all the incoming sequence flows to be triggered before going ahead with the process. In this example, the first task is executed only once, and therefore, if the process comes back at the gateway, it will wait forever.
How process simulation can help?
The process is sufficiently simple here to spot the problem immediately. There might be more complex situations where the glitch is more subtle, or the issue may arise only on very rare occasions. Process simulation can help discover deadlocks and improve your knowledge of the process. It may sound useless to simulate the “as is” situation of a process, but this step is fundamental to assess the reliability of the model. If you’re able to reproduce the reality, you have a solid base on which to predict what happens when changing something (plus a validation of the behavior you expect to observe).
A simulation journey
Let’s start. Open the “Simulate” tab in Cardanit, select the Start Event, add a few tokens, and try to run a first simulation. It fails. You cannot simulate a mixed gateway (a gateway with both multiple incoming and outgoing sequence flows); you have to use one gateway to merge flows and a subsequent one to split again. This is a helpful first step because it forces you to think about the situation. If you simply duplicate the Parallel Gateway, you can run the simulation, but zero tokens will reach the end event. Surprising? No, because the issue is the same as in the original workflow: the converging Parallel Gateway tries to synchronize flows that cannot exist simultaneously. The next tentative is maybe the right one: use the magic wand and transform that Parallel Gateway into an exclusive one.
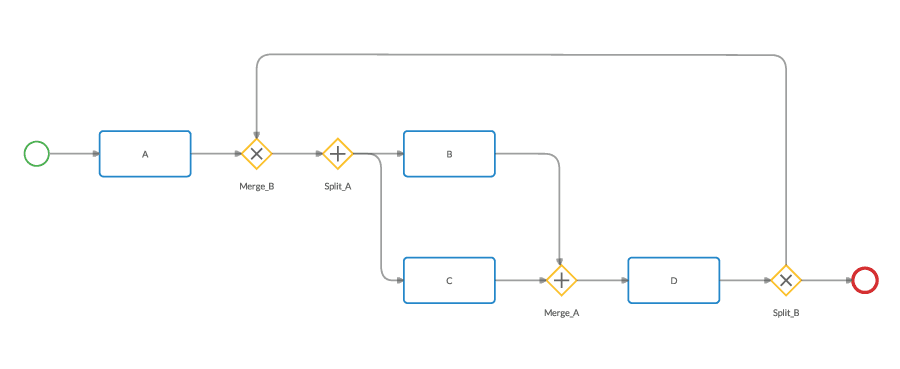
Now that the workflow is correct, let’s do some math. If you set 100 tokens at the start event and keep the default 50-50 splitting rule at the “Split_B” gateway, how many times will task “D” be executed? Think about it for a second. If you vary the “seed” for the simulation, you might obtain slightly different numbers, but the result is significantly higher than 150 (which could have been your answer if you didn’t think through it carefully). Indeed, the 50-50 rule applies every time the process passes through the gateway, not only the first one. Hence, there might be process instances repeating the loop more than once.
Next steps in the journey: time and resources
Flow simulation is just the first level in process simulation. There are at least two others: time and resources. Moreover, you can enrich the model with information about costs (for the activities and the resources involved) and by specifying different parameters depending on calendars (time shifts, seasonal variations, and so on). We need a more complex example to fully appreciate these details. And a bit of patience since Cardanit supports time parameters and calendars at the moment I’m writing, while cost and resources will be released after the summer of 2024.
Time parameters in a real scenario
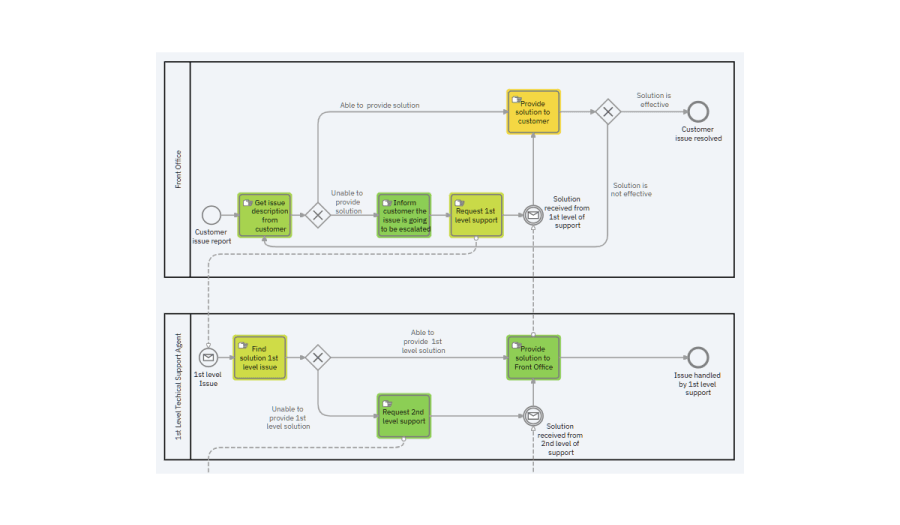
Let’s consider the “Support Request” template. The process starts with a customer asking for a repair. Your company tries to solve the issue with different levels of support and eventually by involving an external supplier. You know with which probability each level of support can handle a case and how much time each task requires. This second parameter rarely is a fixed number. More often, you can express it with a distribution (a normal one, for example, with a central value and a standard deviation). At this point, process simulation can answer two important questions:
- What is the average lead time for the overall process?
- Which tasks require more time, considering their frequency?
A simulation can answer both. Since we’re dealing with probabilities and distributions, we need to repeat the experiment many times. And we can launch 1000 tokens simultaneously since we have yet to start using resources. The simulation result page contains the desired data.
For instance, you can filter the result table to show the lead time for processes.
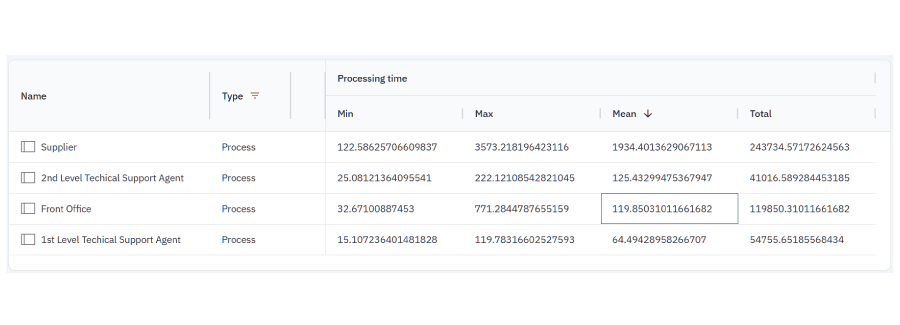
Here, you have the first answer. The average lead time is 119.85 minutes. Moreover, you can also learn the duration of the processes involving each level of support, as well as the minimum and maximum time recorded among all 1000 process instances. The same data can be displayed for all tasks. You can also download the whole table as a CSV file to perform more structured analyses with spreadsheets or other software. The table includes everything you need to know, but the quantity of data can be overwhelming (even with filters). That’s why I prefer to answer the second question with the heatmap.
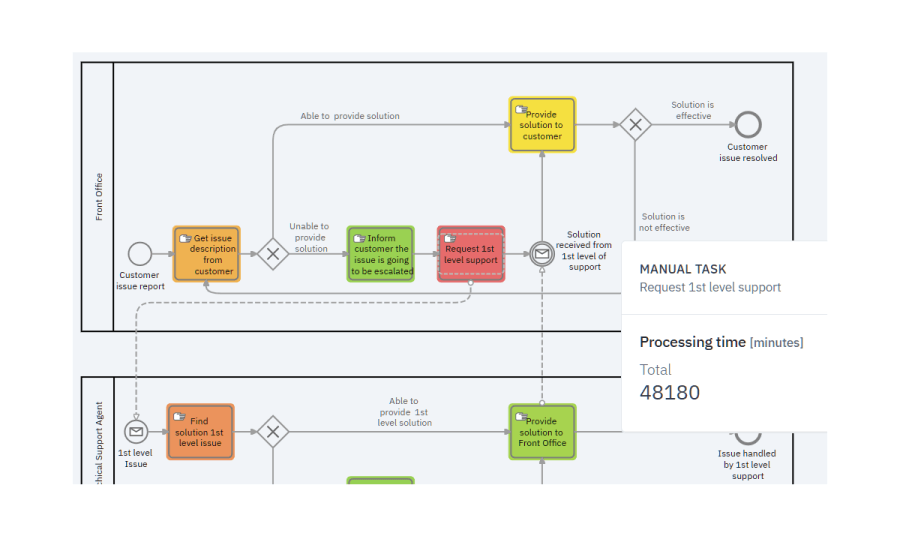
Here, we can immediately find the task with the highest average time and see its exact value by selecting it. You can paint the heatmap with any value, such as the number of completed tokens. The result is a visual, intuitive, qualitative assessment of the desired quantity directly referring to the relative process element.
A little detour: calendars
The next step is adding seasonal variations. We can keep the previous two questions, but now we want to change the task times (and maybe also the gateway probabilities) depending on the hour of the day and the day of the week. You need to create calendars for that: one for the nights and one for the weekends, for example. Then, you can keep the original value as a default choice for all parameters and specify a new one for each calendar. The results differ slightly from the previous ones and obviously depend on how much the values assigned to calendars diverge from the original ones.
The process simulation journey continues
That’s not the end of the journey. Resources are an essential part of a digital twin. What if you receive more repair requests than the available first-level support employees? Then, some process instances will wait for an available resource. The lead time starts will also contain waiting times. The table will show the average resource utilization, and the heatmap will highlight the process bottlenecks. Then, if you also add cost parameters, you can measure how much those bottlenecks impact your company’s finances.
Going back to the initial claim, I still think BPMN is easy. Flow simulation can help test your workflows before automating them and spot deadlocks or unused paths. Process simulation, however, can offer much more. I cannot say that BPSim (the standard for process simulation) is equivalently simple. The few pages of the standard specification hide the difficulties of creating a reliable model - a model that can replicate reality and predict the effects of changes.
Process mining can help in this, as discussed in our previous post. At the same time, I think that also in this metaphor, the journey is more important than the destination. You probably need a lot of trial and error attempts before obtaining a good model, but every iteration increases your knowledge of the process.
Business Process Management is a cycle - it’s a process itself. The more you iterate, the better your processes will be. Have a good journey!
Further reading
Cardanit user documentation: Simulation
Alessandro Turco has a PhD in Applied Math from the International School of Advanced Studies (SISSA) of Trieste and a Master in Management from the School of Management of Milan Polytechnic (MIP). He worked for ESTECO SpA for ten years, starting as a researcher for the Numerical Method Group and then moved to project manager of Cardanit.
Alessandro Turco has a PhD in Applied Math from the International School of Advanced Studies (SISSA) of Trieste and a Master in Management from the School of Management of Milan Polytechnic (MIP). He worked for ESTECO SpA for ten years, starting as a researcher for the Numerical Method Group and then moved to project manager of Cardanit.
A business is only as efficient as its processes. What are you waiting to improve yours?